Questions
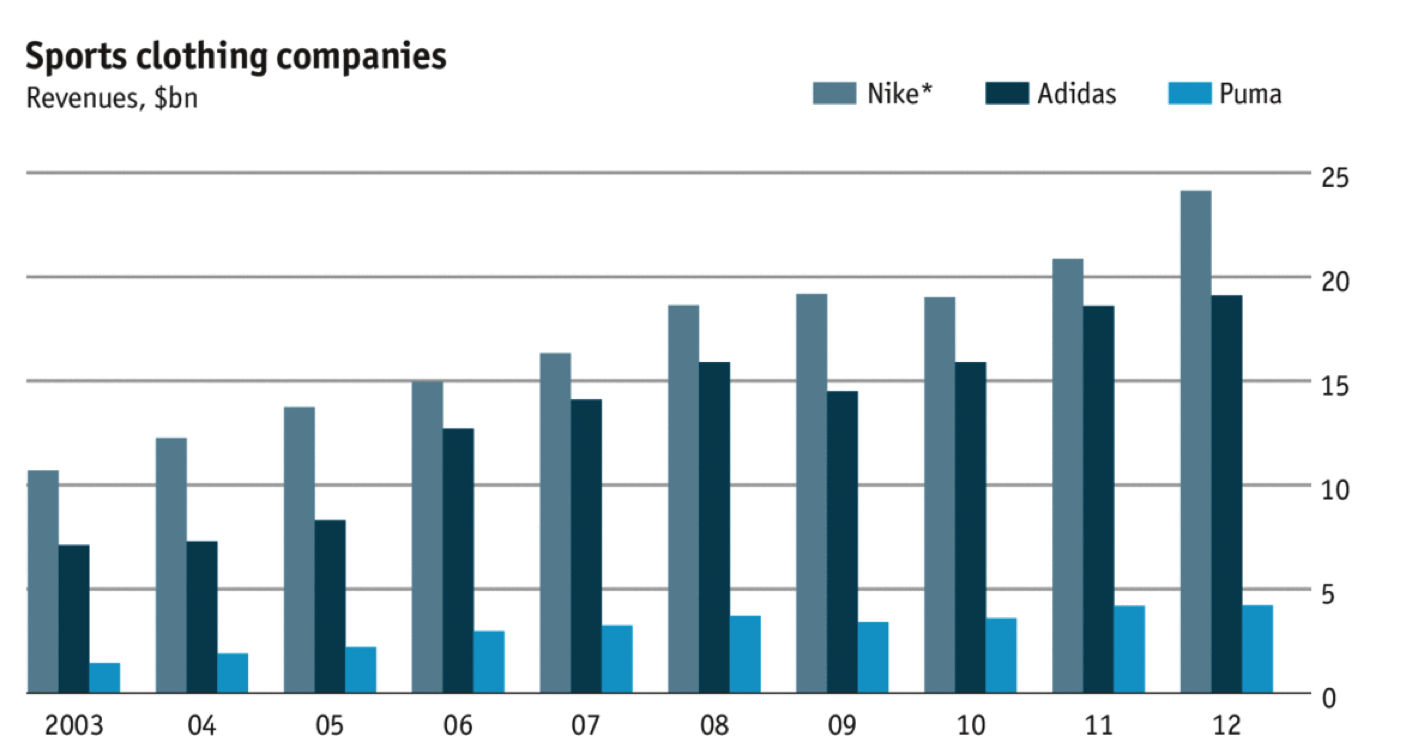
1. What is the range of y-axis? (e.g. 0-35$, do not forget the unit)?
2. Nike's revenue was about how many times than Puma in 2008?
3. Any insight from this chart?
4. I understand this chart very well.
| Strongly disagree | Disagree | Uncertain | Agree | Strongly agree |
5. What is your viewing order when you read a static chart? eg. Start to read from x axis, y axis, legend and content. Please list them the following elements by your reading order (title=1, x-axis=2, y-axis=3, legend=4, content=5.). e.g. 13452
6. Please write down three (adjective) words that you think are most appropriate to describe the effectiveness of a chart

